Apple Corporation
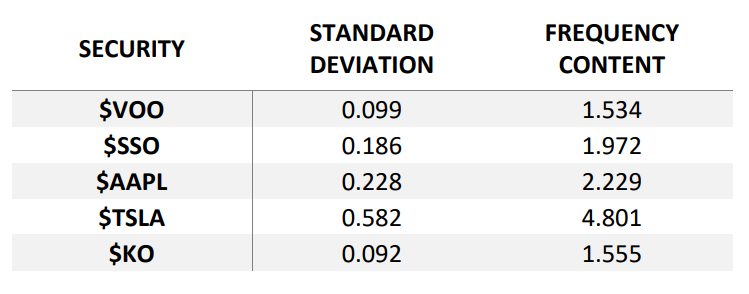
$AAPL stock is middle of the pack when it comes to volatility. Its return chart is shown. Note that $AAPL does not have as low a P/E ratio as $KO, or as high a ratio as $TSLA. The data is normalized to ensure that higher numbers do not show greater volatility artificially. When this is done, it is clearer that $AAPL tends to be in the middle of the pack. The Fourier magnitude of $AAPL is highlighted. One can see that the Fourier magnitude is relatively average compared to the group. This is also shown in the table statistics as well. One can see that $AAPL ends up in the middle of the pack for Fourier Magnitude. This is expected as the volatility is relatively in the middle compared to these other securities.